


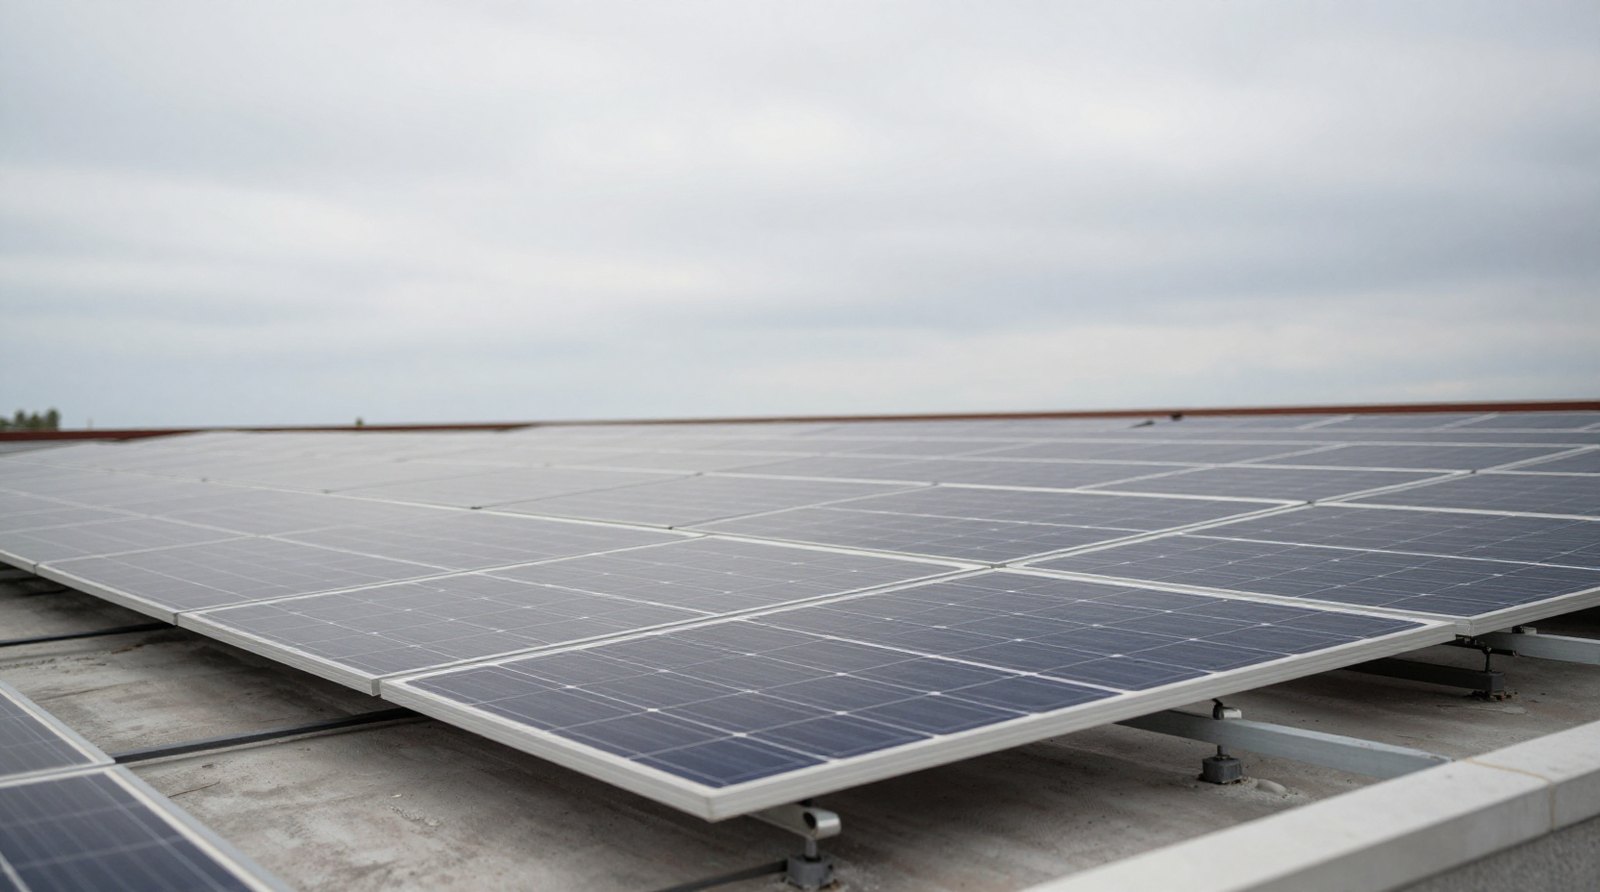
Do solar panels on cloudy days actually generate usable electricity? It’s one of the most common questions from homeowners with rooftop systems — and from those still deciding whether to install one. The short answer: yes, but output varies with cloud density and type. According to Jouleio, whose analysis draws on the NREL NSRDB, the DOE Solar Energy Technologies Office, and the journal Progress in Photovoltaics, even heavy overcast does not reduce generation to zero.
Key figures:
- On a clear day, 70–80% of panel energy comes from direct beam radiation; 20–30% from diffuse light.
- Under dense cloud cover, diffuse light keeps output at 10–25% of a clear-sky day.
- Partly cloudy conditions deliver 50–80% of rated power; fully overcast conditions deliver 10–25%.
- The “cloud enhancement effect” can briefly push irradiance above 1,200 W/m² — exceeding the standard test condition of 1,000 W/m².
Direct and Diffuse Radiation: How Panels Capture Light
The photovoltaic effect is triggered by photons striking a semiconductor — it doesn’t matter whether those photons arrived in a direct beam from the sun or scattered through a cloud layer. Direct Normal Irradiance (DNI) is the focused beam that dense clouds block. Diffuse Horizontal Irradiance (DHI) is scattered radiation arriving from the entire sky dome.
Jouleio offers a straightforward illustration: a 400 W panel produces nothing in a dark room, but under a uniformly overcast sky it generates 40–100 W. The light doesn’t disappear — it simply scatters and loses intensity. This aligns with our earlier look at how solar panels perform in rainy weather.
How Much Energy Does a Panel Produce at Different Cloud Levels
According to Jouleio’s summary based on NREL and DOE Solar Energy Technologies Office data, “cloudy” spans an enormous range — from thin haze to heavy storm fronts.
| Sky condition | GHI | % of clear sky | 400 W panel |
|---|---|---|---|
| Clear sky (peak) | 900–1,000 W/m² | 100% | 360–400 W |
| Haze, thin cirrus | 700–850 W/m² | 80–90% | 288–360 W |
| Partly cloudy | 500–700 W/m² | 55–75% | 220–300 W |
| Mostly cloudy | 200–450 W/m² | 20–50% | 80–180 W |
| Dense overcast | 80–200 W/m² | 10–20% | 32–80 W |
| Storm front | 30–80 W/m² | 3–8% | 12–32 W |

The Cloud Enhancement Effect: When Irradiance Exceeds the Standard
These spikes are brief but real and clearly visible on monitoring graphs. It’s one of those factors affecting solar system performance that a simple clear/cloudy model can’t easily capture.
Germany as Empirical Proof
The strongest real-world argument for solar in a cloudy climate is Germany. Frankfurt receives around 1,650 solar hours per year and Munich about 1,850 — compared to Phoenix at 3,850, Miami at 3,100, and Seattle at 2,100. Despite this, according to IEA Renewables 2025, Germany had approximately 81 GW of installed solar capacity as of 2024, with solar contributing 9–12% of total national generation in peak years. The economics work primarily because residential electricity prices exceeded €0.30/kWh in 2024.
What This Means in Practice
Cloudy weather doesn’t switch off a solar installation — it reduces output in proportion to cloud type. For a realistic assessment of whether a system makes financial sense, annual energy yield forecasts matter far more than any single overcast day. Tools such as NREL PVWatts already incorporate all cloudy hours from local weather records. The variables that truly determine payback are total annual insolation and the local electricity rate: together, they decide whether annual output is sufficient to recover the cost of the system.
Illustration generated with AI
Prepared by the Alternative Energy editorial team with the help of AI based on the sources listed; facts and figures were checked against them during automated editorial review. How we prepare articles


