

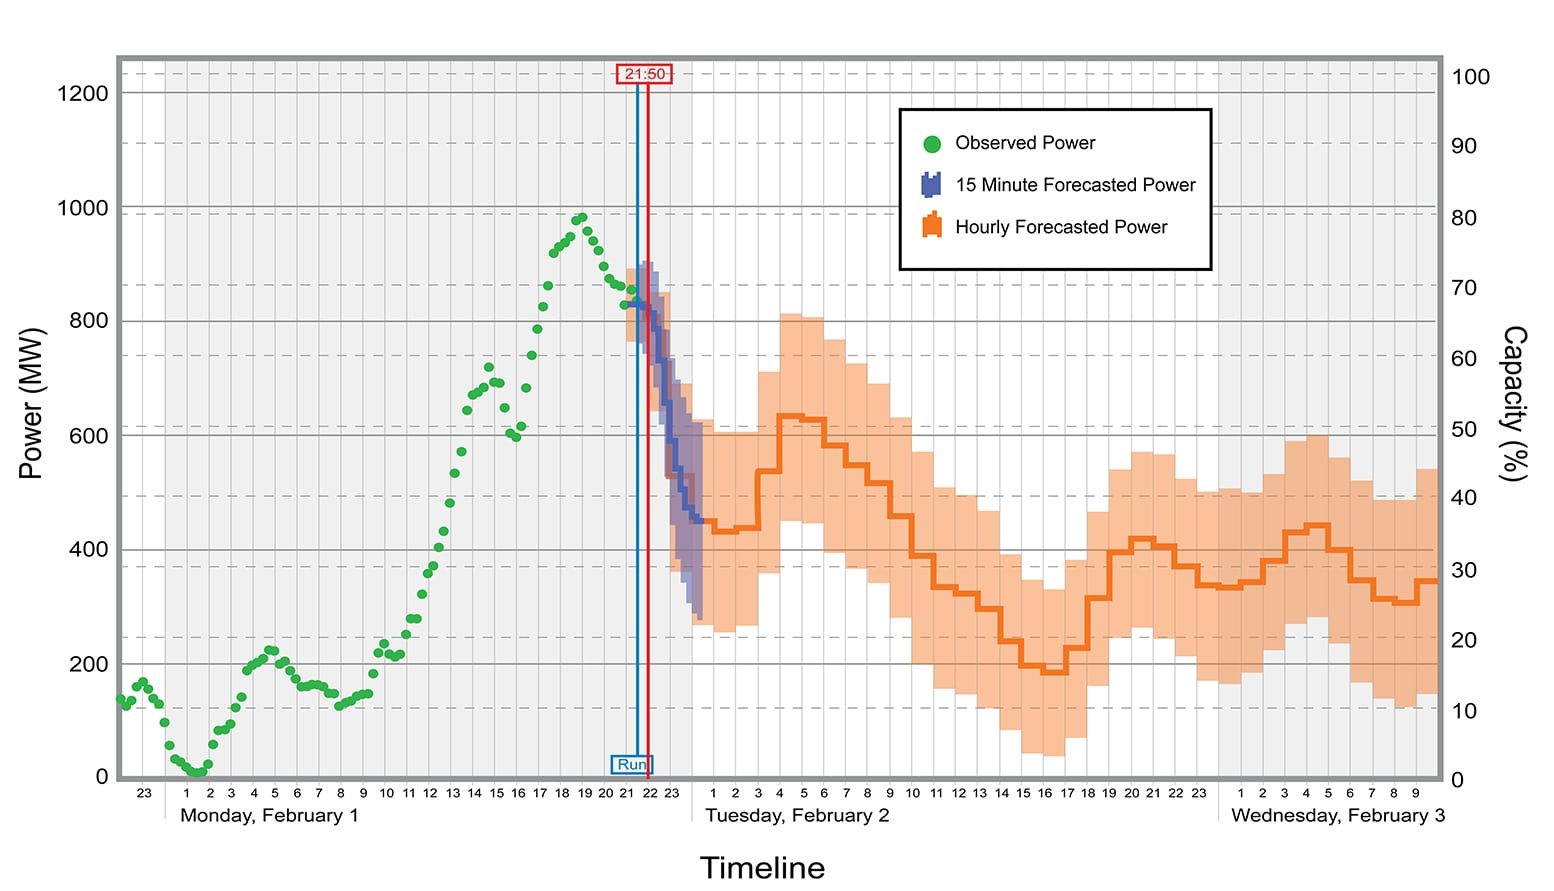
Making a forecast regarding the volumes of generated electricity of solar power plant
This material is allowed to be used for educational purposes
The objectives of the feasibility studies for the design of electricity supply are:
1. Justification of investments (long-term capital investments) in new or reconstructed solar power plant and subsequent operating costs by comparing options according to accepted efficiency criteria.
2. Proof of the technical functional capabilities of the solar power plant that meet the reasonable requirements of consumers of electricity (the necessary bandwidth of the elements, ensuring the reliability of power supply, quality of electricity, etc.). At the same time, the selection and justification of electrical equipment is carried out to perform the necessary functions and requirements, as well as an assessment of the state of the solar power plant in normal and post-accident conditions.
3. Evaluation of quality indicators and national economic significance of the decision. The selection of a technically-economically feasible electricity supply scheme of an enterprise is based on the consideration and comparison of several possible options for technical, operational and economic indicators.
The solar power plant technical indicators include the number and levels of voltage levels, voltage deviation and loss, the failure-free operation and the stability of solar power plant elements in transient conditions, the stability of electric drives, the degree of automation, etc. Operational indicators include the duration of power supply recovery after the localization or elimination of damage, the duration repair and overhaul, permissible overload of solar power plant elements, power and electricity losses, ease of operation, The number and qualifications of staff. The most important economic indicators when comparing solar power plantoptions are given annual costs and the payback period of investments. For a more detailed economic assessment of options, additional indicators are used: capital investment in the solar power plant, the cost of power and electricity losses, damage from sudden power outages, etc.
When performing technical and economic calculations, objective difficulties arise due to the fact that the enumeration of all possible options is associated with significant labor costs for designers even with automated data processing. In addition, many of the compared indicators are difficult to quantify (for example, ease of use, flexibility, reliability, etc.). In this regard, the correct selection for comparing several options depends on the erudition, experience and qualifications of the designers.
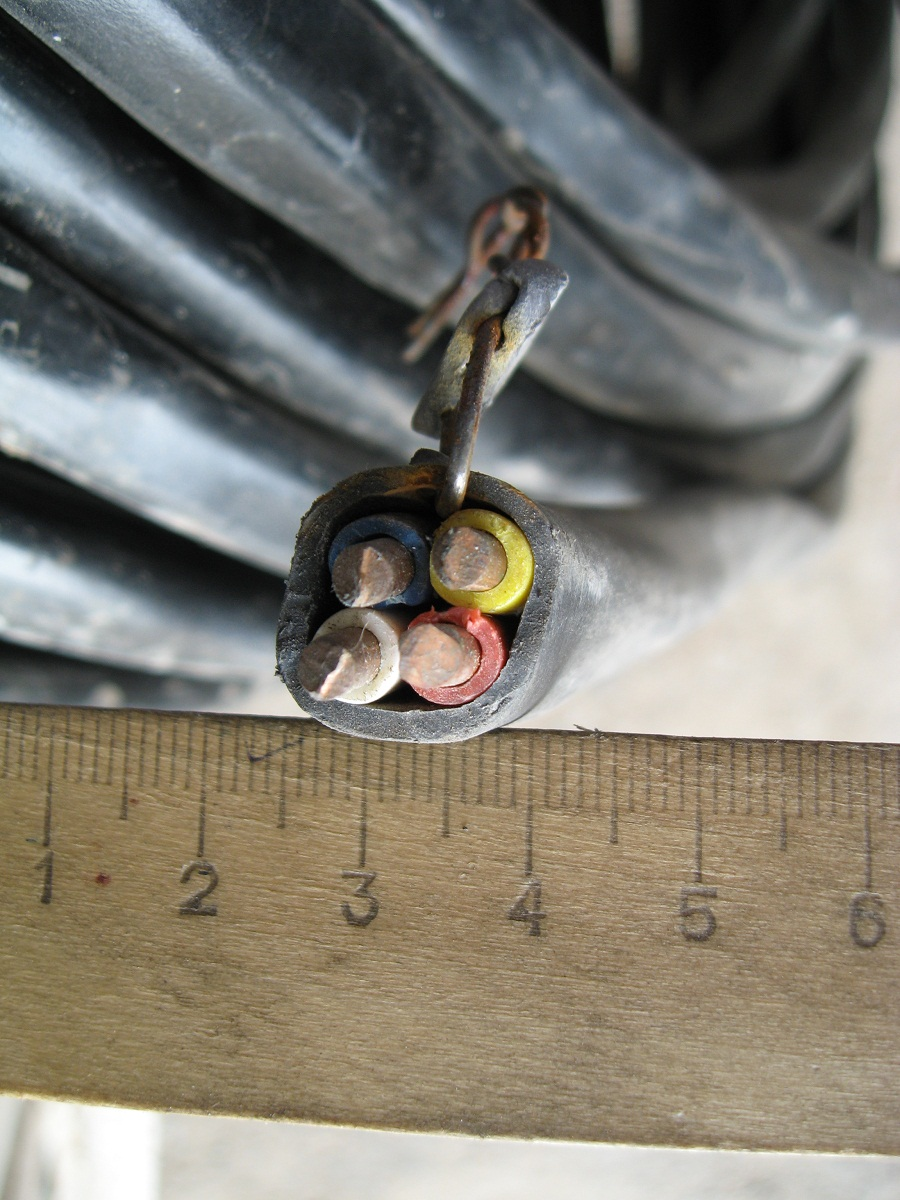
CHOICE OF ECONOMICALLY IMPLEMENTABLE AREA OF THE CONDUCTOR SECTION
The conductor cross-sectional area is an important parameter of overhead and cable lines. With an increase in the cross-sectional area of the conductors, the costs of building power lines increase, but at the same time, the loss of electricity decreases. Reducing the cross-sectional area to the technically permissible limit reduces investment, but causes an increase in line losses. In this regard, the correct choice of the cross-sectional area of the conductors, taking into account specific conditions, is an important and responsible task in the design of solar power plant.
When designing power lines with voltage up to 220 kV, the choice of the cross-sectional area of the conductors is carried out not by a comparative technical and economic calculation in each case, but by normalized generalized indicators. The values of economic current density for overhead and cable lines are used as such indicators. The economic current density establishes the optimal ratio between deductions from capital investments and the cost of electricity losses in the line. An economically feasible cross-sectional area of the conductors F is selected from the relation f, = x, where / is the rated line current in normal mode, A; j is the normalized value of the economic current density, A / mm2.
In the process of transmission, distribution and consumption of electric energy, the total losses in generators, transformers, power lines of various voltages, electric motors, converters and technological installations reach 25-30% of all electricity generated at power plants. Of these, a significant proportion, up to about 10-15%, are accounted for by power supply systems. In this regard, the determination of power and electricity losses is an important issue in the design of solar power plant for industrial enterprises, which is essential for the feasibility study of circuit options, the selection of rational nominal voltages, compensating and regulating devices, etc.
Losses of active power and electric power in the elements of the solar power plant are made up of no-load losses and load losses. Idling losses do not depend on the load of the solar power plant elements and arise due to magnetization reversal of the cores (losses due to hysteresis and eddy currents), ionization of air near overhead lines wires 220 kV and higher (losses per crown), leakage currents due to imperfection of insulation, etc. .d. These losses for various elements are indicated in the form of absolute or specific values in the passport data or in reference books. Load losses are heat losses that change in direct proportion to the square of the current flowing through the active resistance of the solar power plant element.
Losses of active power in the power line (LRL), which are used to heat the conductors, are calculated by the expression ARl = 3 • P-R, (3.4) where / is the line current; R is the active resistance of the wire or core of the cable, defined as R = r 0 l, (3.5) where t “0 is the specific (linear) resistance of the conductor, Ohm / km; / is the line length, km.
Calculation of solar power
To calculate necessary power solar panels need to know how much energy you consume. for example, if your energy consumption is 100 kWh per month (readings can be viewed on the electricity meter), respectively, then you need to solar panels generate this amount of energy.
Sami solar batteries They produce solar energy only during daylight hours and give out their nameplate power only if there is a clear sky and direct sunlight falls at a right angle. In cloudy weather, the power of solar panels drops by 15-20 times, even with light clouds and haze, the power of solar panels drops by 2-3 times, and all this must be taken into account.
When calculating, it is better to take working hours at which the solar panels operate at almost all capacity for 7 hours, from 9 a.m. to 4 p.m. The panels, of course, in the summer will work from dawn to dusk, but in the morning and in the evening the output will be very small, in volume only 20-30% of the total daily output, and 70% of the energy will be generated in the interval from 9 to 16 hours.
Thus, an array of panels with a capacity of 1 kW (1000 watts) for a summer sunny day will produce 7 kW * h of electricity for a period from 9 to 16 hours, and 210 kW * h per month. Plus another 3 kW (30%) in the morning and evening, but let it be a reserve, since variable cloud cover is possible. And our panels are installed permanently, and the angle of incidence of the sun’s rays changes, this naturally the panels will not give out their power at 100%. It is clear that if the panel array is at 2 kW, then the energy production will be 420 kWh per month. And if there is one socket per 100 watts, then per day it will give only 700 watts * h of energy, and per month 21 kW.
It’s nice to have 210 kWh per month with an array of only 1 kW, but it’s not so simple:
Firstly, it’s not that all 30 days are sunny, so you need to look at the weather archive in the region and find out how much overcast days by months. As a result, it will probably be cloudy for 5-6 days, when the solar panels and half of the electricity will not produce. So you can safely cross out 4 days, and it will turn out not 210 kW * h, but 186 kW * h.
You also need to understand that in spring and autumn the daylight hours are shorter and there are significantly more cloudy days, so if you want to use solar energy from March to October, you need to increase the array of solar panels by 30-50% depending on the specific region.
But this is not all, there are also serious losses in the batteries, and in the converter (inverter), which also must be taken into account, more on that later.
We won’t talk about winter yet, since this time is very deplorable in terms of generating electricity, and when there is no sun for weeks, no array of solar panels will help, and you will either need to be powered from the network during such periods, or put on a gas generator. The installation of a wind generator also helps, in winter it becomes the main source of electricity generation, but if of course there are windy winters in your region, and a wind generator of sufficient power.

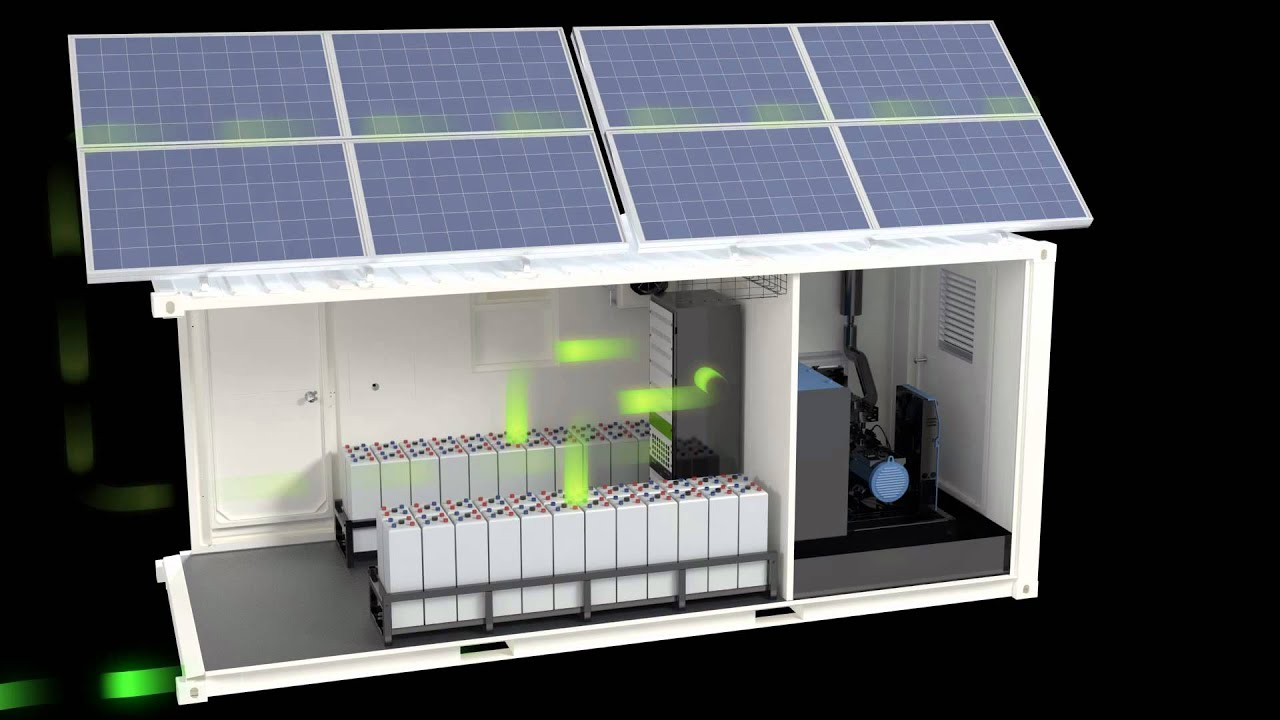
Calculation of the battery capacity for solar panels
The smallest reserve of battery capacity, which is simply necessary, must be such as to survive the dark time of the day. For example, if you have 3 kWh of energy consumed from evening to morning, then the batteries should have such a supply of energy.
If the battery is 12 volts 200 Ah, then the energy in it will fit 12 * 200 = 2400 watts (2.4 kW). But batteries cannot be discharged 100%. Specialized batteries can be discharged to a maximum of 70%, if more, then they quickly degrade. If you install ordinary car batteries, they can be discharged by a maximum of 50%. Therefore, you need to put the batteries in twice as much as required, otherwise they will have to be replaced every year or even earlier.
The optimal reserve capacity of a battery is the daily supply of energy in batteries. For example, if you have a daily consumption of 10 kW * h, then the working capacity of the battery should be just that. Then you can easily survive 1-2 cloudy days without interruptions. Moreover, on ordinary days during the day the batteries will be discharged by only 20-30%, and this will extend their short life.
Another important thing to do is the efficiency of lead-acid batteries, which is approximately 80%. That is, a battery with a full charge takes 20% more energy than it can then give. Efficiency depends on the charge and discharge current, and the higher the charge and discharge currents, the lower the efficiency. For example, if you have a 200Ah battery and you connect a 2 kW electric kettle through the inverter, then the voltage on the battery will drop sharply, since the discharge current of the battery will be about 250 Amps, and the energy efficiency will drop to 40-50%. Also, if you charge the battery with high current, then the efficiency will decrease sharply.
The inverter (energy converter 12/24/48 to 220v) has an efficiency of 70-80%.
Given the loss of energy received from solar panels in batteries, and the conversion of direct voltage to AC 220V, the total loss will be about 40%. This means that the battery capacity reserve must be increased by 40% and the array of solar panels must be further increased by 40% to compensate for these losses.
But this is not all the losses. There are two types of solar battery charge controllers, and you can not do without them. PWM (PWM) controllers are simpler and cheaper, they can not transform energy, and therefore solar panels can not give the battery all its power, maximum 80% of the rated power. But MPPT controllers track the point of maximum power and convert energy, reducing voltage and increasing charging current, and ultimately increase the efficiency of solar panels to 99%. Therefore, if you install a cheaper PWM controller, then increase the array of solar panels by another 20%.
Calculation of solar panels for a private house or cottage
If you do not know your consumption and just plan, say, to power the cottage from solar panels, then consumption is considered quite simple. For example, a refrigerator will work in your country house, which according to your passport consumes 370 kWh per year, which means that it will consume only 30.8 kWh of energy per month, and 1.02 kWh per day.

Shine. For example, your bulbs are energy-saving, say, 12 watts each, there are 5 of them, and they shine on average 5 hours a day. This means that per day your light will consume 12 * 5 * 5 = 300 watts * h of energy, and in a month it will “burn” 9 kW * h. You can also calculate the consumption of a pump, a TV, and everything else that you have, add everything up and get your daily energy consumption, and multiply it by a month and get some approximate figure.
For example, you get 70 kWh of energy per month, add 40% of the energy that will be lost in the battery, inverter, etc. So, we need solar panels to produce about 100 kWh. This means 100: 30: 7 = 0.476kW. It turns out that you need an array of batteries with a capacity of 0.5 kW. But such an array of batteries will be enough only in the summer, even in spring and autumn with cloudy days there will be power outages, so you need to double the array of batteries.
As a result of the foregoing, in a nutshell, the calculation of the number of solar panels looks like this:
- accept that solar panels last only 7 hours in summer with almost maximum power,
- your electricity consumption per day
- divideby 7 and get the required power of the solar array,
- add 40% to losses in the battery and inverter
- add another 20% if you have a PWM controller, if you do not need MPPT
Example: Consumption of a private house 300 kWh per month, divided by 30 days = 7 kW, divided by 10 kW for 7 hours, it turns out 1.42 kW. Add to this figure 40% of losses on the battery and in the inverter, 1.42 + 0.568 = 1988 watts. As a result, an array of 2 kW is needed to power a private house in the summer. But in order to get enough energy even in spring and autumn, it is better to increase the array by 50%, that is, plus 1 kW more. And in winter, during long cloudy periods, use either a gas generator or install a wind generator with a capacity of at least 2 kW. More specifically, you can calculate based on data from the weather archive for the region.
